

![]()
af-analysis is a python package for the analysis of AlphaFold protein structure predictions.
This package is designed to simplify and streamline the process of working with protein structures
generated by:
Source code repository: https://github.com/samuelmurail/af_analysis
AlphaFold 2 and its derivatives have revolutionized protein structure prediction, achieving remarkable accuracy.
Analyzing the abundance of resulting structural models can be challenging and time-consuming.
Existing tools often require separate scripts for calculating various quality metrics (pDockQ, pDockQ2, LIS score) and assessing model diversity.
af-analysis addresses these challenges by providing a unified and user-friendly framework for in-depth analysis of AlphaFold 2 results.
- Import AlphaFold or ColabFold prediction directories as pandas DataFrames for efficient data handling.
- Calculate and add additional structural quality metrics to the DataFrame, including:
- pDockQ
- pDockQ2
- LIS score (cLIS and iLIS scores)
- ipSAE (and the ipTM matrix derived from PAE)
- Visualize predicted protein models.
- Cluster generated models to identify diverse conformations.
- Select the best models based on defined criteria.
- Add your custom metrics to the DataFrame for further analysis.
af-analysisis available on PyPI and can be installed usingpip:
pip install af_analysis- You can install last version from the github repo:
pip install git+https://github.com/samuelmurail/af_analysis.git@main- AF-Analysis can also be installed easily through github:
git clone https://github.com/samuelmurail/af_analysis
cd af_analysis
pip install .You can install and launch the GUI with:
pip install "af-analysis[gui]"
af_analysis_gui
Then open http://127.0.0.1:5000 in your browser. The GUI allows loading result folders, viewing tables, selecting models, and plotting pLDDT/PAE.
- For developers, you can install the package in editable mode:
git clone https://github.com/samuelmurail/af_analysis
cd af_analysis
pip install -e .A conda environment file is provided to create an environment with all dependencies:
conda env create -f environment.yml
conda activate af_analysisThe complete documentation is available at ReadTheDocs.
-
A notebook showing the basic usage of the
af_analysislibrary can be found here. -
Alternatively you can test is directly on Google colab:
Create the Data object, giving the path of the directory containing the results of the alphafold2/colabfold run.
import af_analysis
my_data = af_analysis.Data('MY_AF_RESULTS_DIR')
In most cases, the Data object will automatically detect the format of the results (AlphaFold 2, AlphaFold 3, ColabFold). If needed, you can specify the format using the format argument:
my_data = af_analysis.Data('MY_AF_RESULTS_DIR', format='afpulldown')Extracted data are available in the df attribute of the Data object.
my_data.dffrom af_analysis import analysis
analysis.pdockq(my_data)
analysis.pdockq2(my_data)from af_analysis import docking
docking.LIS_pep(my_data)
docking.ipSAE(my_data)- At first approach the user can visualize the pLDDT, PAE matrix and the model scores. The
show_info()function displays the scores of the models, as well as the pLDDT plot and PAE matrix in a interactive way.
- plot msa, plddt and PAE:
my_data.plot_msa()
my_data.plot_plddt([0,1])
best_model_index = my_data.df['ranking_confidence'].idxmax()
my_data.plot_pae(best_model_index)- show 3D structure (
nglviewpackage required):
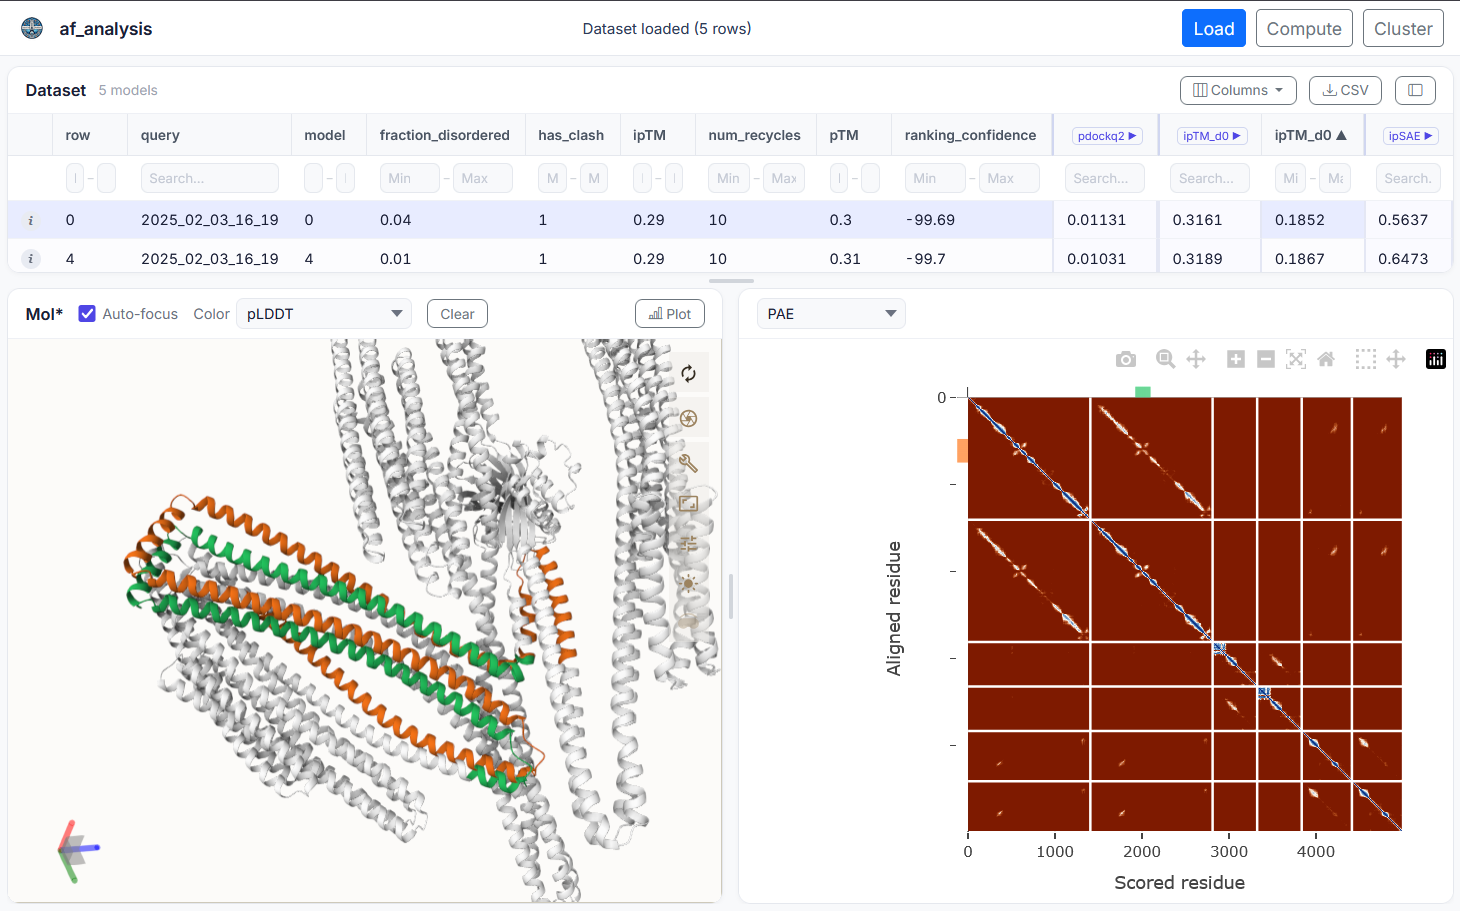
my_data.show_3d(my_data.df['ranking_confidence'].idxmax())af-analysis includes an optional web-based graphical user interface (GUI) built with Flask. It allows you to load result folders, browse model tables, select models, and plot pLDDT and PAE interactively — without writing any code.
Model structures can also be visualized in 3D using Mol* directly in the browser. The GUI is designed to be user-friendly and accessible to researchers who may not be comfortable with command-line tools.
pdockq2, LIS score, and ipSAE can also be calculated directly from the GUI, allowing users to quickly assess the quality of their models and make informed decisions about which ones to focus on for further analysis.
Install and launch the GUI with:
pip install "af-analysis[gui]"
af_analysis_gui
Then open http://127.0.0.1:5000 in your browser.
af_analysis requires the following dependencies:
pdb_cpppandasnumpytqdmseaborncmcrameringlviewipywidgetsmdanalysis
as well as the optional dependencies for the GUI:
Flaskplotly
af-analysis is an open-source project and contributions are welcome. If
you find a bug or have a feature request, please open an issue on the GitHub
repository at https://github.com/samuelmurail/af_analysis. If you would like
to contribute code, please fork the repository and submit a pull request.
- Alaa Regei, Graduate Student - Université Paris Cité.
- Samuel Murail, Associate Professor - Université Paris Cité, CMPLI, RPBS platform.
See also the list of contributors who participated in this project.
To release a new version of the package, follow these steps:
- Commit the changes and push to GitHub:
git add .
git commit -m "Update of ..."
git push origin main- Update the version number in using bump-my-version:
bump-my-version bump <part>where <part> is one of major, minor, or patch depending on the type of release.
- Commit the changes and push to GitHub:
git add .
git commit -m "Bump version to x.y.z"
git push origin main- Create the pypi package and upload it:
make releaseRemember that a valid .pypirc file must be present in your home directory with the correct credentials.
If you use the code of this package, please cite:
- Reguei A and Murail S. Af-analysis: a Python package for Alphafold analysis.
Journal of Open Source Software (2025) doi: 10.21105/joss.07577
@Article{reguei_af-analysis_2025,
	title = {Af-analysis: a {Python} package for {Alphafold} analysis},
	volume = {10},
	issn = {2475-9066},
	shorttitle = {Af-analysis},
	url = {https://joss.theoj.org/papers/10.21105/joss.07577},
	doi = {10.21105/joss.07577},
	language = {en},
	number = {107},
	urldate = {2025-03-14},
	journal = {Journal of Open Source Software},
	author = {Reguei, Alaa and Murail, Samuel},
	month = mar,
	year = {2025},
	pages = {7577},
}This project is licensed under the GNU General Public License version 2 - see the LICENSE file for details.
- Jumper et al. Nature (2021) doi: 10.1038/s41586-021-03819-2
- Abramson et al. Nature (2024) doi: 10.1038/s41586-024-07487-w
- Mirdita et al. Nature Methods (2022) doi: 10.1038/s41592-022-01488-1
- Evans et al. bioRxiv (2021) doi: 10.1101/2021.10.04.463034
- Bryant et al. Nat. Commun. (2022) doi: 10.1038/s41467-022-28865-w
- Zhu et al. Bioinformatics (2023) doi: 10.1093/bioinformatics/btad424
- Kim et al. bioRxiv (2024) doi: 10.1101/2024.02.19.580970
- Yu et al. Bioinformatics (2023) doi: 10.1093/bioinformatics/btac749
- Wohlwend et al. bioRxiv (2024) doi: 10.1101/2024.11.19.624167
- Chai Discovery et al. bioRxiv (2024) doi:10.1101/2024.10.10.615955v2
- MassiveFold Raouraoua et al. Nat. Comput. Sci. (2024) doi:10.1038/s43588-024-00714-4
- Dunbrack. Biorxiv (2025) doi: 10.1101/2025.02.10.637595
- check with the original implementation of pDockQ2 that the results are the same
- Same for LIS/LIA