Usage Guide
Open the OIE Administrator and click the Thread Viewer tab in the dashboard panel.
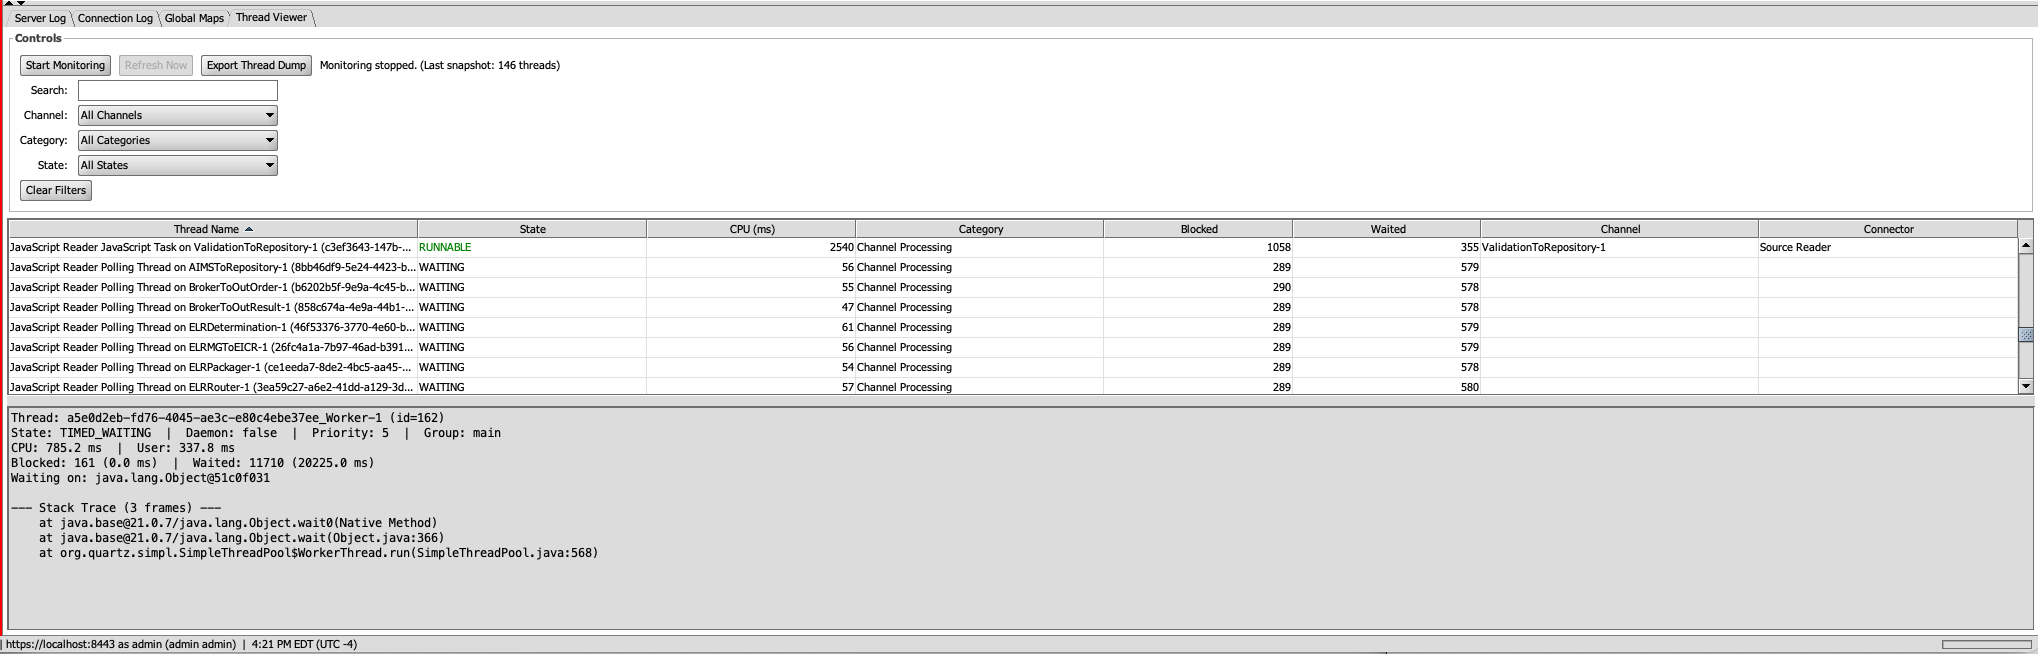
| Button | Description |
|---|---|
| Start Monitoring | Enables JVM thread contention monitoring and begins polling for thread snapshots every 5 seconds |
| Stop Monitoring | Stops polling and disables contention monitoring. Thread data is retained for browsing |
| Refresh Now | Triggers an immediate snapshot fetch (available while monitoring) |
| Export Thread Dump | Saves a jstack-compatible thread dump file (available after first snapshot) |
| Clear Filters | Resets all filter fields to defaults |
The table displays all JVM threads with the following columns:
| Column | Description |
|---|---|
| Thread Name | Full JVM thread name |
| State | Thread state: RUNNABLE (green), BLOCKED (red), TIMED_WAITING (orange), WAITING, NEW, TERMINATED |
| CPU (ms) | Total CPU time consumed by this thread |
| Category | Auto-classified category based on thread name patterns |
| Blocked | Number of times this thread has been blocked |
| Waited | Number of times this thread has entered a wait state |
| Channel | OIE channel name (resolved from channel ID in thread name) |
| Connector | OIE connector name (e.g., "Source Reader", destination connector name) |
Click any column header to sort. Default sort is CPU time descending to surface hot threads.
Click any thread row to view its full details in the bottom pane:
- Thread ID, state, daemon status, priority, thread group
- CPU and user time
- Blocked and waited counts with durations
- Lock info (what the thread is waiting on, who holds the lock)
- Deadlock indicator
- Channel and connector association
- Complete stack trace
All filters compose with AND logic. The table updates immediately as you type or change selections.
| Filter | Description |
|---|---|
| Search | Free-text match against thread name, channel name, or channel ID |
| Channel | Dropdown populated from deployed channels on the server (updates each refresh) |
| Category | Thread category: Channel Processing, Database Pool, HTTP/Servlet, Event System, Plugin, Scheduler, JMX/Management, System/JVM, Other |
| State | Thread state filter |
Threads are automatically classified based on their name patterns:
| Category | Thread Name Patterns |
|---|---|
| Channel Processing |
JavaScript Reader/Writer, channel-, Source_, Destination_
|
| Database Pool |
pool-, HikariCP, dbcp, c3p0
|
| HTTP / Servlet |
http-, qtp, jetty, servlet
|
| Event System |
event-, Event
|
| Plugin |
plugin-, Plugin
|
| Scheduler |
Scheduler, Timer-, quartz, cron
|
| JMX / Management |
JMX, RMI, management
|
| System / JVM |
Reference, Finalizer, Signal, GC, CompilerThread, VM
|
| Other | Everything else |
When you click Stop Monitoring, the last captured snapshot remains in the table. You can continue to browse threads, view stack traces, apply filters, and export the dump file without active monitoring.