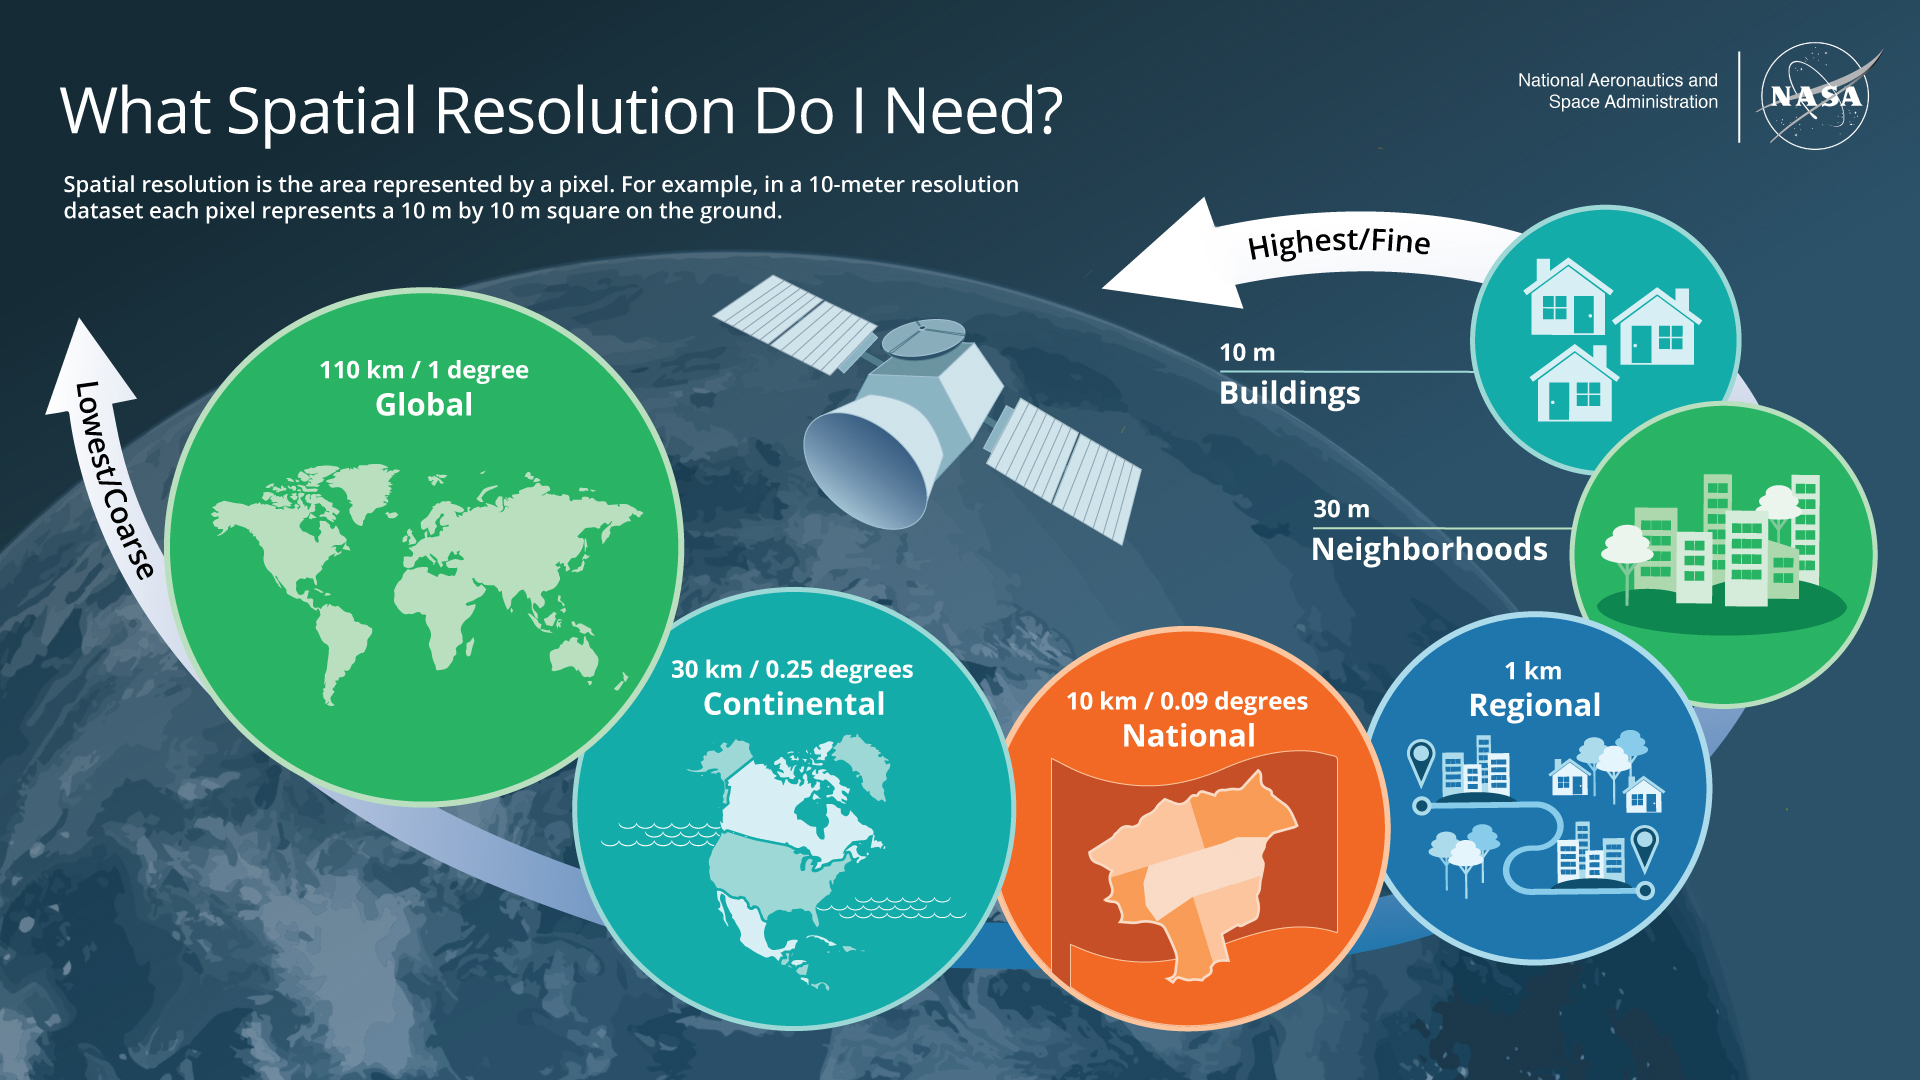

A collection of Python utilities for preprocessing and analyzing satellite and geospatial data: generic raster/vector GIS helpers, a reader/plotter for NASA Harmonized Landsat Sentinel-2 (HLS) products, a reader/plotter for MODIS MOD13Q1/MYD13Q1 vegetation index time series, and tools for working with in-situ water quality observation points.
remote_sensing/
├── GIS/
│   ├── raster.py       # Raster (GeoTIFF) I/O, validation, reprojection, plotting
│   ├── vector.py       # Vector (Shapefile) I/O, CRS handling, plotting
│   └── coordinate.py   # DMS <-> decimal degree coordinate conversion
├── HLS.py              # HLS L30/S30 band reader, plotter, and water index calculator
├── MODIS.py            # MOD13Q1/MYD13Q1 NDVI/EVI time series reader, QA decoder, and plotter
├── water_quality/
│   └── obs.py          # Observation point <-> GeoDataFrame, raster sampling, Folium plotting
├── tutorials/          # Worked preprocessing examples (see tutorials/README.md)
├── requirements.txt
└── LICENSE
tutorials/ has worked, raw-to-analysis-ready preprocessing notebooks that build on the modules above. Currently:
hls_l30_s30— cross-sensor comparison of NASA HLS L30 (Landsat) and S30 (Sentinel-2), covering valid-pixel ROI intersection, RGB composites, cross-sensor NDVI, and each product's unique bands (L30 thermal, S30 red edge).modis_vi_timeseries— multi-year MODIS MOD13Q1 NDVI/EVI time series over rice-paddy cropland, covering Pixel Reliability masking, NDVI-vs-EVI seasonal comparison, and simple start/peak/end-of-season phenology extraction.
This project depends on GDAL, rasterio, and cartopy, which are C-extension-heavy geospatial libraries. Installing them via conda/mamba (conda-forge channel) is more reliable than plain pip on most platforms:
conda create -n remote-sensing python=3.12
conda activate remote-sensing
conda install -c conda-forge rasterio gdal cartopy geopandas folium tqdm numpy pandas matplotlib
If GDAL is already available on your system, you can instead use:
pip install -r requirements.txtGeneral-purpose raster/vector GIS helpers.
from GIS import raster, vector, coordinate

# Raster
data, transform, crs = raster.read("path/to/raster.tif")
raster.plot(data, transform=transform, cmap="viridis")

# Vector
gdf = vector.read("path/to/vector.shp")
vector.plot(gdf)

# Coordinate conversion
dd = coordinate.dms_to_dd("37° 43' 55.0\"")Reader, plotter, and water-index calculator for NASA HLS L30/S30 surface reflectance products.
import HLS

reader = HLS.BandReader(folder_path="path/to/hls/scene", product="S30", date="2026001")
plotter = HLS.BandPlotter(reader)

plotter.plot_rgb(title="True color")
plotter.plot_false_color(title="False color (NIR-R-G)")

water_calc = HLS.WaterIndicesCalculator(reader)
mndwi, transform = water_calc.calculate_mndwi()
plotter.plot_index(mndwi, transform, threshold=0.1, title="MNDWI")

clear_mask = HLS.is_cloud(reader.qa)
water_mask = HLS.is_water(reader.qa)Reader, QA decoder, and plotter for MODIS MOD13Q1/MYD13Q1 vegetation index time series (as exported by NASA AppEEARS, one NetCDF file per AOI covering every requested date).
import MODIS

reader = MODIS.VITimeSeriesReader("path/to/MOD13Q1.061_250m_aid0001.nc")
ndvi = reader.ndvi()  # masked via Pixel Reliability by default
evi = reader.evi()

bbox = (126.70, 35.65, 127.05, 35.95)  # west, south, east, north (WGS84)
ndvi_roi = reader.roi_mean(ndvi, bbox=bbox)  # AOI-mean time series

plotter = MODIS.VIPlotter(reader)
plotter.plot_timeseries(ndvi_roi, label="NDVI")
plotter.plot_map(ndvi.isel(time=0).values, title="NDVI snapshot")

reliable_mask = MODIS.is_reliable(reader.reliability().values)Utilities for working with in-situ water quality observation points.
from water_quality import obs

gdf = obs.points_to_gdf("path/to/obs_points.csv")
samples = obs.extract_pixels_near_points(gdf, raster_data, transform, radius_deg=0.001)
m = obs.plot_points("path/to/obs_points.csv", "3008B40")Distributed under the MIT License. See LICENSE for details.
Developed by Seongjun Lee