Mine Rehabilitation Intelligence for Western Australia's Iron Ore Industry
Live demo: https://rehabtrack-ivory.vercel.app
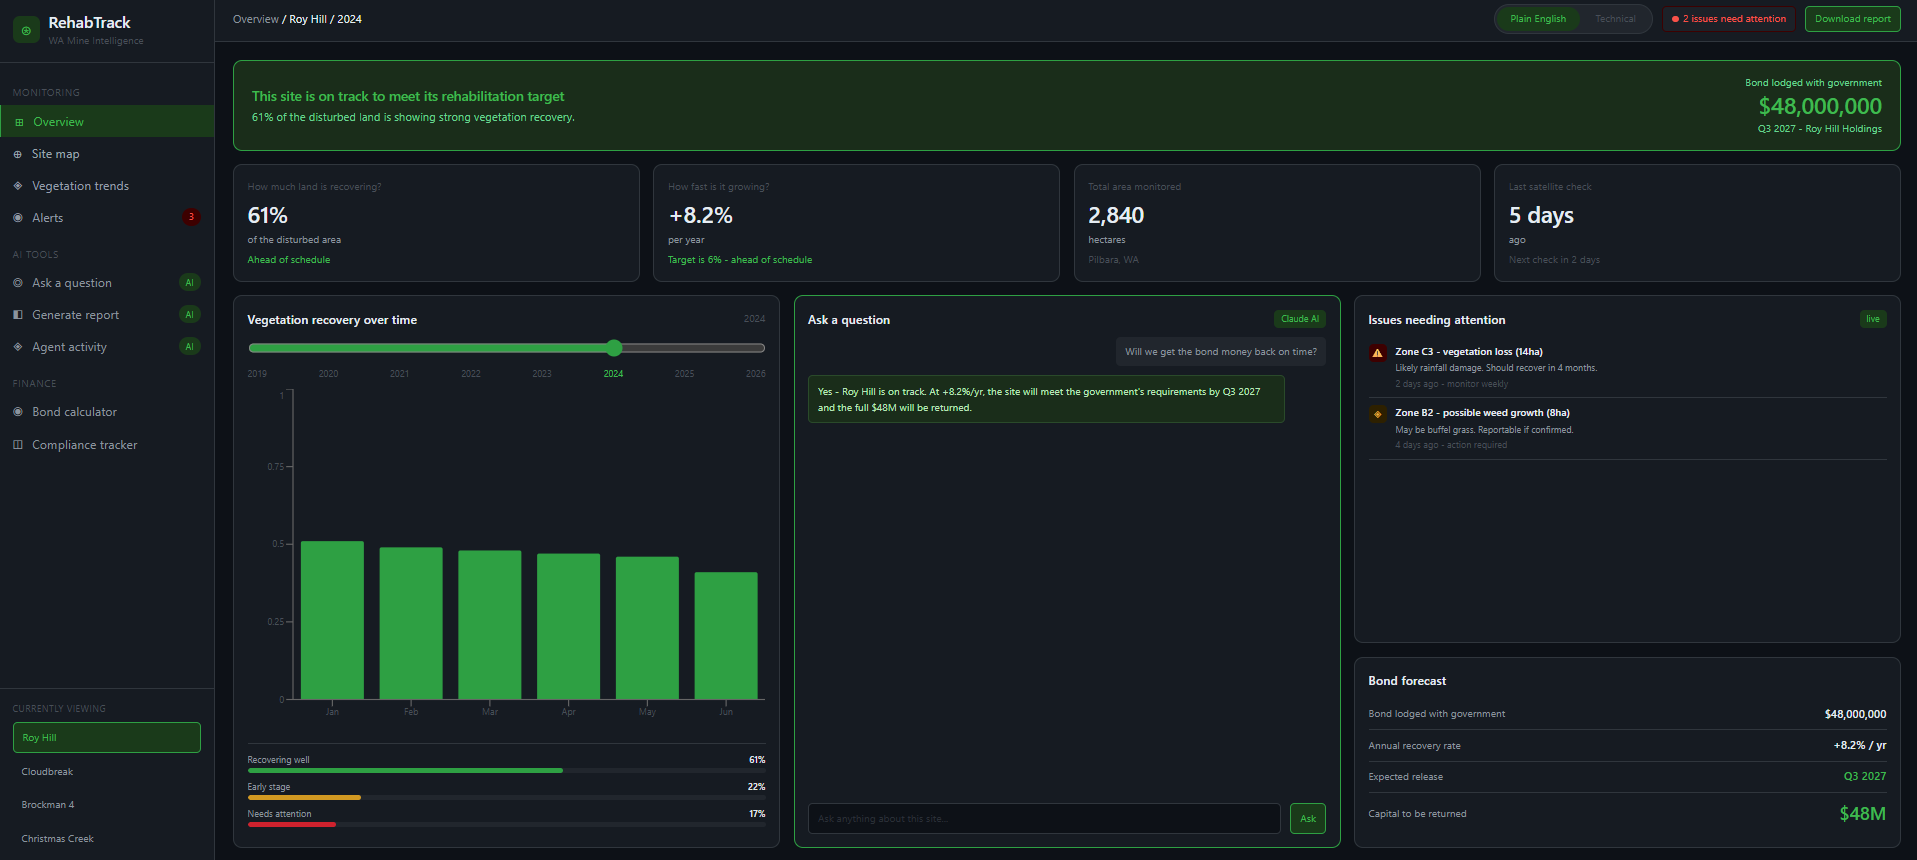
Western Australia's iron ore operators carry a rehabilitation obligation that does not end at mine closure. It follows the land. Under the Mining Act 1978, operators must lodge an Unconditional Performance Bond with the state government before mining begins. That bond is held by the Department of Energy, Mines, Industry Regulation and Safety (DEMIRS) and is only released once the land meets the vegetation recovery targets defined in the approved Mine Closure Plan, which must be resubmitted to DEMIRS every three years.
The bond is not a fee. It is capital. It earns nothing while it sits with the government, and the operator carries the cost of that tied-up money for every year the land falls short of its recovery targets.
Across the four Pilbara sites MineRehabTrack monitors, that locked capital totals $186 million.
The gap is not in effort. Most operators are investing seriously in rehabilitation. The gap is in visibility. Vegetation recovery unfolds across thousands of hectares of remote land, checked through quarterly ground inspections and annual reports to regulators. Problems such as soil erosion after heavy rainfall, invasive weeds spreading from a haul road boundary, or a replanting programme failing to take hold can begin quietly and grow for months before anyone confirms them on the ground.
By the time the problem is documented, the recovery timeline has already shifted. The bond release date moves. The cost of fixing it grows. And the next submission to DEMIRS reflects a programme that is behind where it should be.
Sentinel-2 is a European Space Agency satellite that photographs the Pilbara at 10 metre resolution every five days. That imagery is freely available and has been since 2016. It contains a detailed, repeatable record of vegetation health across every rehabilitation zone on every major iron ore site in the region.
MineRehabTrack processes real Sentinel-2 data extracted via Google Earth Engine and compares each reading against the same zone's historical pattern to flag anything unusual before it shows up in a quarterly inspection report.
Here is what the data shows across the four sites:
Roy Hill, Zone C3. Following heavy rainfall in June 2024, vegetation health in this zone dropped sharply over 30 days. The satellite recorded the change two days after the event. A ground inspection would not have confirmed it for weeks.
Roy Hill, Zone B2. The spectral signature of the vegetation in this zone does not match the native plants expected in a rehabilitated Pilbara environment. The pattern is consistent with buffel grass, a declared invasive weed under WA law. If confirmed on the ground, this is a reportable event under the Mine Closure Plan.
Christmas Creek, Zone E1. This zone has shown almost no vegetation recovery for five consecutive months. At its current rate, it will not reach the government's release threshold until 2035. The bond release target for the site is 2030.
Cloudbreak, Zone A1. This zone has sustained healthy vegetation levels for four consecutive months and has reached the government's milestone. The $62 million bond lodged for this site is on track for release in Q1 2027.
These are readings from actual satellite passes. Not projections.
Locked capital has a real cost. A $48 million bond held at 5% annual financing represents roughly $2.4 million per year in opportunity cost. Identifying a problem six weeks earlier than a ground inspection, and treating it before it spreads, directly compresses that timeline.
Regulators expect continuous progress. DEMIRS assesses rehabilitation against the approved Mine Closure Plan at each triennial review. A system that produces a continuous, auditable record of vegetation recovery across every zone gives operators a stronger foundation for that submission than one assembled from periodic site visits.
The same data serves different audiences. A Chief Financial Officer needs to understand the bond release date and what is putting it at risk. An environmental scientist needs the underlying vegetation measurements and confidence levels. A regulator needs zone-level records referenced against the Mine Closure Plan. MineRehabTrack generates all three from the same data, at the same time, using AI.
Better decisions before money is spent. Before committing to a $400,000 to $800,000 replanting programme, a site manager can model the projected bond release date, the months recovered, and the net financial benefit against the cost, under normal conditions, drought, or a cyclone event.
Satellite monitoring. Real Sentinel-2 NDVI data for all four sites, January 2016 to June 2026, extracted via Google Earth Engine at 10 metre resolution. Zone-level breakdowns per site. Anomaly detection against a 10-year seasonal baseline.
AI anomaly alerts. Three AI agents work in sequence. The Watcher scans satellite imagery and flags unusual changes. The Analyst searches 10 years of historical data and WA Mining Act context to classify the cause and severity. The Reporter surfaces findings to the dashboard and emails the site manager. A live simulation shows the full process running in real time.
Ask a question. Conversational AI powered by Claude (Anthropic). Ask anything about the selected site in plain English or technical mode. Answers are grounded in satellite data, DMIRS guidelines, and the WA Mining Act 1978. The system only answers questions relevant to mine rehabilitation.
Generate report. Executive and Analyst versions generated at the same time from the same data. Plain English with financial figures for business leaders. Technical measurements, zone references, and regulatory citations for environmental teams. Downloadable as PDF.
Scenario planner. Model any intervention decision against any external condition. Outputs include projected bond release date, months recovered versus doing nothing, financing costs saved, and net benefit after intervention cost.
Bond calculator. Interactive financial model per site. Current and downside scenarios. Updates automatically when switching sites.
Compliance tracker. Portfolio view of all four sites and $186 million in bonds. Recovery rate versus regulatory target, active alerts, and bond release status per site. Portfolio-level compliance report on demand. CSV export.
Interactive site map. Zone polygons per site with year slider from 2016 to 2026. Three view modes: recovery status, satellite imagery, and change over time.
Full light and dark mode.
Why a serverless function for the API? The Claude API key cannot be exposed in the browser. All AI requests route through a Vercel serverless function that reads the key securely from environment variables. This is how API credentials are handled in production systems.
Why a guardrail on the Ask AI page? Without it, Claude answers anything, which turns the product into a generic chatbot. The system prompt restricts Claude to mine rehabilitation topics only, with a specific redirect message for anything off-topic.
Why both Executive and Analyst modes? The same data means different things to different audiences. Both versions are generated via parallel API calls and cached - no regeneration needed when switching.
Why real GEE data for all four sites? The initial prototype used synthetic NDVI offsets applied to a Roy Hill baseline for the other three sites. MineRehabTrack now uses real Sentinel-2 data extracted via Google Earth Engine for all four sites independently, covering January 2016 to June 2026.
Why 2016 as the start date? Sentinel-2A launched in June 2015 and Sentinel-2B in March 2017. Consistent, high-frequency coverage at 10m resolution across the Pilbara became reliable from early 2016 onward. Starting from 2016 gives a 10-year baseline for seasonal anomaly detection.
React 19, Vite, Tailwind CSS, React Router, Recharts, Leaflet, Claude API (Anthropic), Vercel serverless functions, Google Earth Engine (satellite data export), Python, Pandas
- Sentinel-2 NDVI: Google Earth Engine, COPERNICUS/S2_SR_HARMONIZED, January 2016 to June 2026, 10m resolution
- Bond values: Roy Hill Holdings Annual Report 2024, Fortescue Metals Group Annual Report 2024, Rio Tinto Annual Report 2024
- Regulatory framework: WA Mining Act 1978, DMIRS Mine Closure Guidelines, Mining Rehabilitation Fund Act 2012
git clone https://github.com/Dev4221/rehabtrack
cd rehabtrack
npm install
Create .env in the root directory:
VITE_ANTHROPIC_API_KEY=your_key_here
Start the local API proxy (required for AI features when running locally):
node server.jsStart the application:
npm run devAI features on Vercel route through a serverless function automatically. No local proxy required.
Devansh Bhuta - Data Analyst and AI Engineer, Perth WA
Master of Business Analytics, University of Western Australia. Previous work includes a player recruitment analytics framework for the Perth Wildcats (National Basketball League) that reduced evaluation time by 80% and was featured on 10News Perth, 20 hours of monthly reporting automated at a SaaS business (DashboardWorX), and a 70% improvement in data accuracy at an AI content platform (WryteAI).
I build tools that turn operational data into decisions - not just dashboards that display numbers.