本文博客地址:Canvas 实例之绘制雷达图(蛛网图).
之前在开发中需要用到雷达图(蛛网图),这里总结下使用 canvas 绘制雷达图的步骤。
对于雷达图这种中心对称的图形,绘制的要点就是找到圆心的位置,设为中心点,然后边旋转边绘制。
演示:
See the Pen
canvas draw radar by tcatche (@tcatche)
on CodePen.
<script async src="https://cpwebassets.codepen.io/assets/embed/ei.js"></script>
下面来拆分一下绘制步骤:
接口定义
首先先定义接口和使用:
class Rader {
  draw() {
    this.drawGrid(); // 绘制网格
    this.drawLines(); // 绘制链接网格的线
    this.drawData(); // 绘制数据组成的多边形
    this.drawText(); // 绘制标签
  }
}

// 使用方式
new Rader({
  ele: document.getElementById('canvas'),
  radius: 100, // 绘制半径
  gridTurns: 5, // 蛛网的圈数
  data: [ // 根据 data 长度决定绘制几边形
    { label: '速度', value: 60, },
    { label: '力量', value: 50, },
    { label: '爆发力', value: 70, },
    { label: '耐久力', value: 60, },
    { label: '强度', value: 80, },
    { label: '气势', value: 10, },
  ]
}).draw();
核心语法
涉及到的核心语法主要有以下几个:
ctx.translate 更改 canvas 的原点,本例设置为多边形的中心点。ctx.rotate 旋转 casvas,本例通过旋转每次只需要绘制固定坐标 [width, 0] 可以有效降低计算坐标的复杂度;ctx.save 保存 canvas 全部状态,由于每次绘制都会进行旋转,每次绘制前保存状态,避免多次旋转后角度错乱导致错位;ctx.restore 还原上次保存的状态,每次绘制结束后进行还原;ctx.beginPath/ctx.closePath 用来关闭路径,避免不同的路径进行交叉;ctx.moveTo/ctx.lineTo 用来绘制一段直线。
初始化
constructor(options) {
  this.options = options;
  this.ctx = options.ele.getContext('2d');
  this.ctx.translate(options.ele.width / 2, options.ele.height / 2); // 指定绘制的原点为 canvas 的中心
  this.edgesCount = options.data.length; // 几边形由数据的长度确定
  this.rotateStep = (2 * Math.PI) / this.edgesCount; // 每次旋转的度数,注意是弧度单位而不是角度。
}上面初始化主要指定了绘制的原点,方便计算每个要绘制的点,以及每次需要旋转的弧度。
下面开始具体图案的绘制,其实每次绘制都很类似。
绘制背景网格
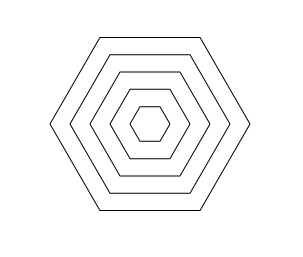
具体代码
drawGrid() {
  const { options, ctx, edgesCount, rotateStep } = this;
  ctx.save();
  ctx.beginPath();
  for (let i = 0; i < options.gridTurns; i += 1) { // 根据网格的圈数进行循环
    const DRAW_RADIUS = ((i + 1) * options.radius) / options.gridTurns; // 计算每一圈网格的半径
    ctx.moveTo(DRAW_RADIUS, 0);

    for (let j = 0; j < edgesCount; j += 1) { // 每一圈网格都是一个绘制小多边形的步骤
      ctx.rotate(rotateStep);
      ctx.lineTo(DRAW_RADIUS, 0);
    }
  }
  ctx.closePath();
  ctx.stroke();
  ctx.restore();
}
绘制网格连接的线
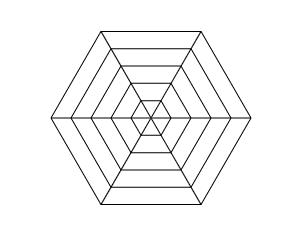
具体代码
drawLines() {
  const { options, ctx, edgesCount, rotateStep } = this;
  ctx.save();
  ctx.beginPath();
  for (let i = 0; i < edgesCount; i += 1) {
    ctx.rotate(rotateStep);
    ctx.moveTo(0, 0);
    ctx.lineTo(options.radius, 0);
  }
  ctx.closePath();
  ctx.stroke();
  ctx.restore();
}
绘制数据
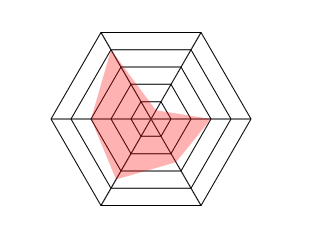
具体代码
drawData() {
  const { options, ctx, edgesCount, rotateStep } = this;
  ctx.save();
  const data = options.data.map((item) => Math.round(item.value * options.radius / 100)); // 根绝数据的百分比确定数据的绘制长度
  ctx.beginPath();
  ctx.moveTo(data[0], 0);
  for (let i = 1; i < edgesCount; i += 1) {
    ctx.rotate(rotateStep);
    ctx.lineTo(data[i], 0);
  }
  ctx.rotate(this.rotateStep);
  ctx.lineTo(data[0], 0);
  ctx.fillStyle = 'rgba(255, 0, 0, 0.3)';
  ctx.fill();
  ctx.closePath();
  ctx.restore();
}
绘制标签
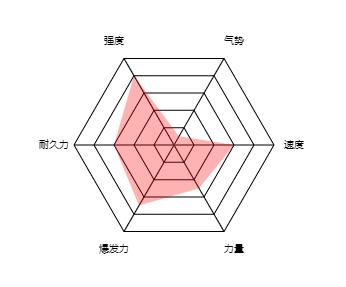
具体代码:
drawText() {
    const { options, ctx, edgesCount, rotateStep } = this;
    ctx.save();
    const data = options.data.map((item) => item.label);
    ctx.font = '12px';
    ctx.textBaseline = 'middle';
    ctx.textAlign = 'center'
    const textRadius = options.radius + 20;
    for (let i = 0; i < edgesCount; i += 1) {
      const currentAngle = rotateStep * i;
      ctx.fillText(data[i], textRadius * Math.cos(currentAngle), textRadius * Math.sin(currentAngle));
    }
    ctx.restore();
  }
}
绘制标签的难点是需要计算标签的文本的坐标,这里用到正弦和余弦函数 x = cos(deg) * r, y = sin(deg) * r
注意,每次绘制前使用 ctx.save() 保存当前状态,绘制完成后使用 ctx.restore() 恢复保存的状态,这样可以避免绘制几次后找不到初始的状态。上面的每个绘制都是如此操作的。
完整代码和演示
点击查看完整代码
演示:
See the Pen
canvas draw radar by tcatche (@tcatche)
on CodePen.
<script async src="https://cpwebassets.codepen.io/assets/embed/ei.js"></script>
本文博客地址:Canvas 实例之绘制雷达图(蛛网图).
之前在开发中需要用到雷达图(蛛网图),这里总结下使用 canvas 绘制雷达图的步骤。
对于雷达图这种中心对称的图形,绘制的要点就是找到圆心的位置,设为中心点,然后边旋转边绘制。
演示:
See the Pen canvas draw radar by tcatche (@tcatche) on CodePen.
<script async src="https://cpwebassets.codepen.io/assets/embed/ei.js"></script>下面来拆分一下绘制步骤:
接口定义
首先先定义接口和使用:
核心语法
涉及到的核心语法主要有以下几个:
ctx.translate更改 canvas 的原点,本例设置为多边形的中心点。ctx.rotate旋转 casvas,本例通过旋转每次只需要绘制固定坐标[width, 0]可以有效降低计算坐标的复杂度;ctx.save保存 canvas 全部状态,由于每次绘制都会进行旋转,每次绘制前保存状态,避免多次旋转后角度错乱导致错位;ctx.restore还原上次保存的状态,每次绘制结束后进行还原;ctx.beginPath/ctx.closePath用来关闭路径,避免不同的路径进行交叉;ctx.moveTo/ctx.lineTo用来绘制一段直线。初始化
上面初始化主要指定了绘制的原点,方便计算每个要绘制的点,以及每次需要旋转的弧度。
下面开始具体图案的绘制,其实每次绘制都很类似。
绘制背景网格
具体代码
绘制网格连接的线
具体代码
绘制数据
具体代码
绘制标签
具体代码:
绘制标签的难点是需要计算标签的文本的坐标,这里用到正弦和余弦函数
x = cos(deg) * r,y = sin(deg) * r注意,每次绘制前使用
ctx.save()保存当前状态,绘制完成后使用ctx.restore()恢复保存的状态,这样可以避免绘制几次后找不到初始的状态。上面的每个绘制都是如此操作的。完整代码和演示
点击查看完整代码
演示:
See the Pen canvas draw radar by tcatche (@tcatche) on CodePen.
<script async src="https://cpwebassets.codepen.io/assets/embed/ei.js"></script>