I tried to look at your benchmarks. Unfortunately, I can see much, because the axes are linear and not logarithmic. It could be helpful to put at least time on log axis. Also, tabular results would be great for accessibility and convenience. 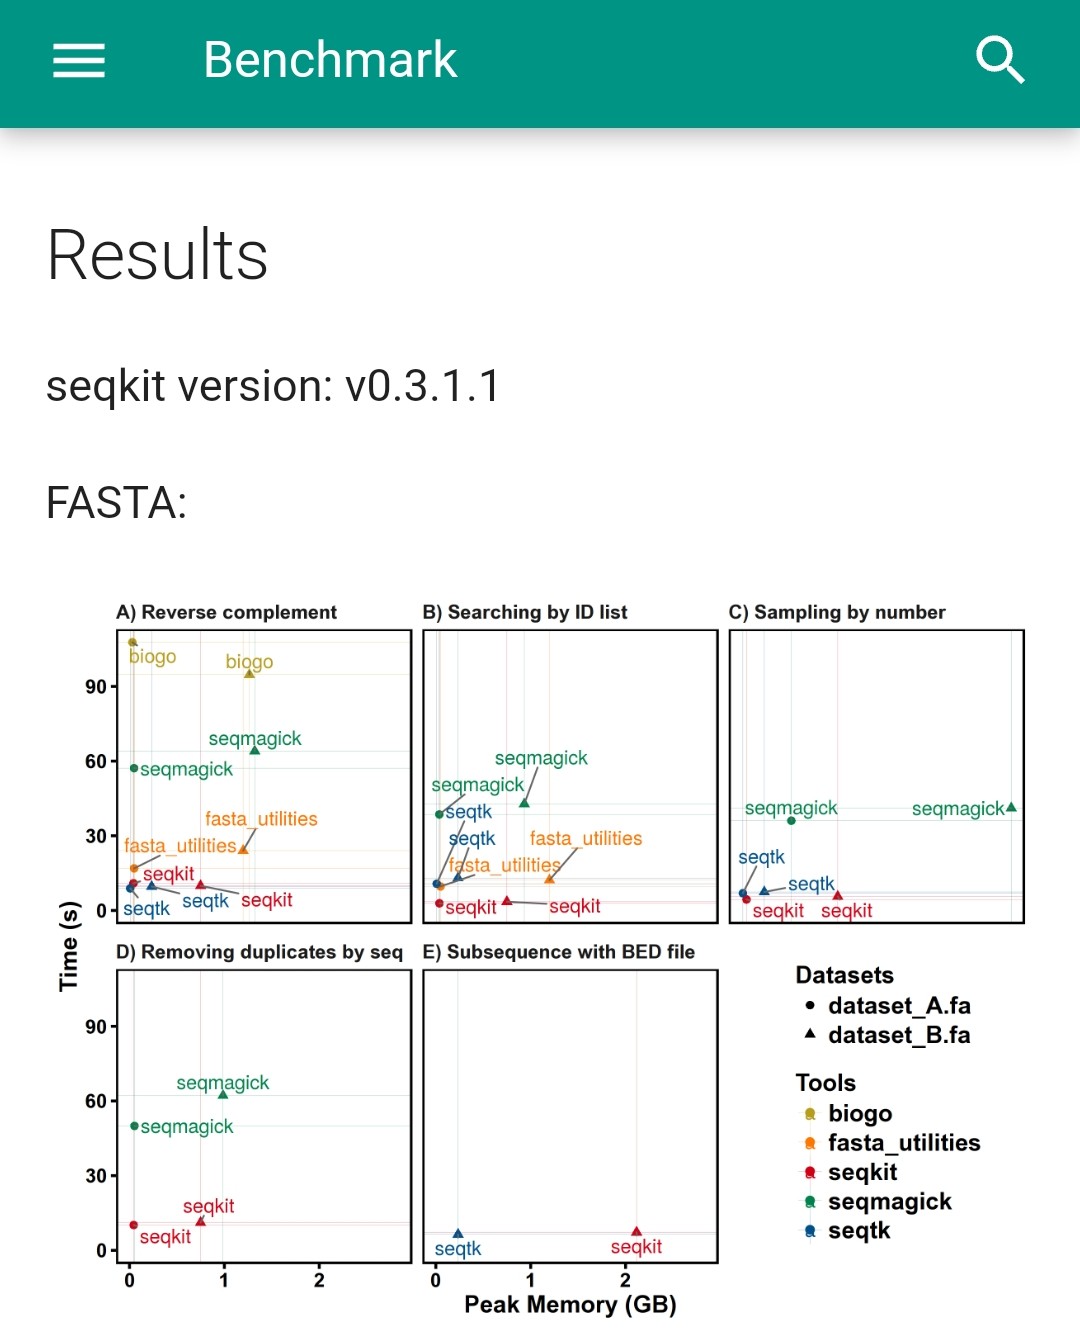
I tried to look at your benchmarks.
Unfortunately, I can see much, because the axes are linear and not logarithmic.
It could be helpful to put at least time on log axis.
Also, tabular results would be great for accessibility and convenience.