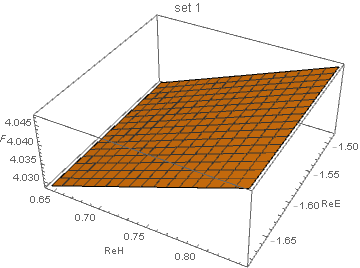
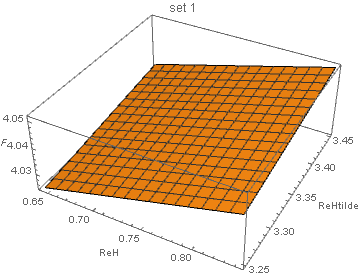
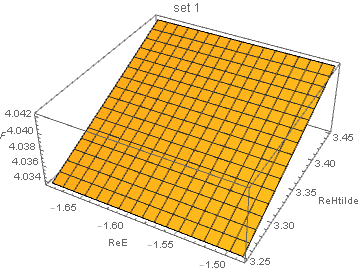
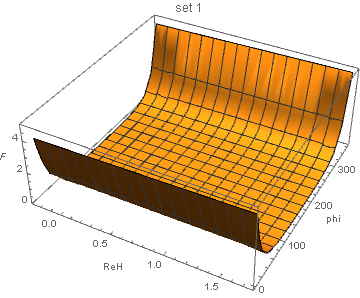
These plots were created by:
- varying two Compton Form Factors on the x- and y-axis near their true values from set 1
- keeping all other kinematics and CFFs fixed from set 1 in the dataset "dvcs_xs_May-2021_342_sets_with_trueCFFs"
The code and interactive features are published here
(ReH ± 0.1) vs. (ReE ± 0.1)
(ReH ± 0.1) vs. (ReHtilde ± 0.1)
(ReE ± 0.1) vs. (ReHtilde ± 0.1)
(ReH ± 1) vs. (phi from 8 to 360)
(ReE ± 1) vs. (phi from 8 to 360)
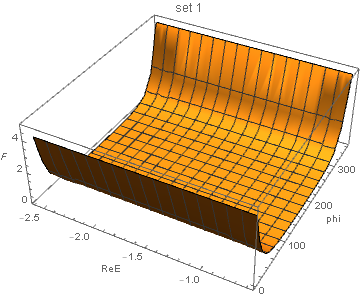
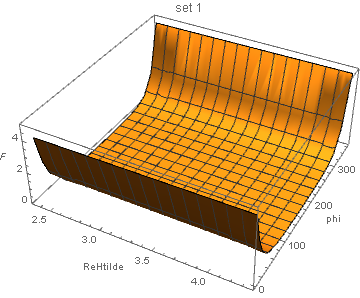
(ReHtilde ± 1) vs. (phi from 8 to 360)
These plots were created by:
The code and interactive features are published here
(ReH ± 0.1) vs. (ReE ± 0.1)
(ReH ± 0.1) vs. (ReHtilde ± 0.1)
(ReE ± 0.1) vs. (ReHtilde ± 0.1)
(ReH ± 1) vs. (phi from 8 to 360)
(ReE ± 1) vs. (phi from 8 to 360)
(ReHtilde ± 1) vs. (phi from 8 to 360)