Hello,
I tried to plot 300 images with geom_image. It worked, but when I try to color images, most of images vanished.
Do you know why ?
library("ggplot2")
library("ggimage")

# create a df

set.seed(2017-02-21)
d <- data.frame(x = rnorm(300),
                y = rnorm(300),
                image = sample(c("https://www.r-project.org/logo/Rlogo.png",
                                 "https://jeroenooms.github.io/images/frink.png"),
                               size=10, replace = TRUE)
)
# plot2
ggplot(d, aes(x, y)) + geom_image(aes(image=image)", size=.05)
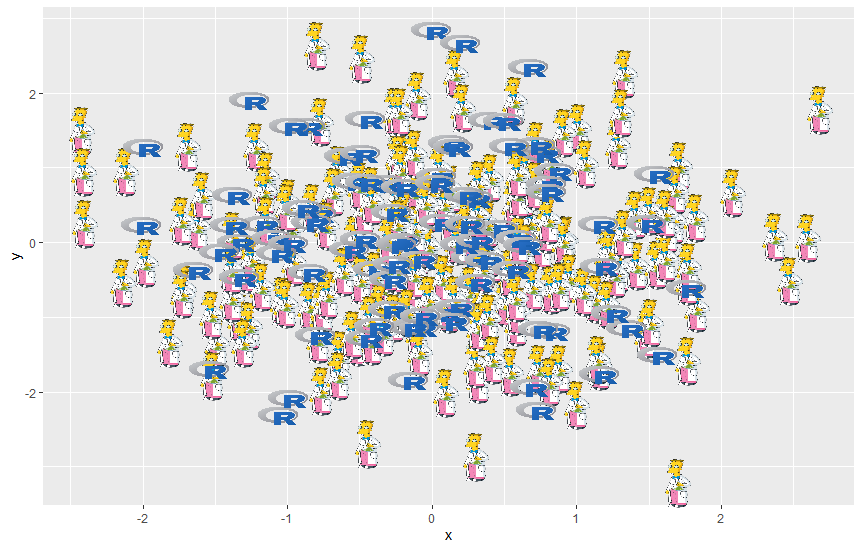
library("ggplot2")
library("ggimage")

# create a df

set.seed(2017-02-21)
d <- data.frame(x = rnorm(300),
                y = rnorm(300),
                image = sample(c("https://www.r-project.org/logo/Rlogo.png",
                                 "https://jeroenooms.github.io/images/frink.png"),
                               size=10, replace = TRUE)
)
# plot2
ggplot(d, aes(x, y)) + geom_image(aes(image=image), color="red", size=.05)
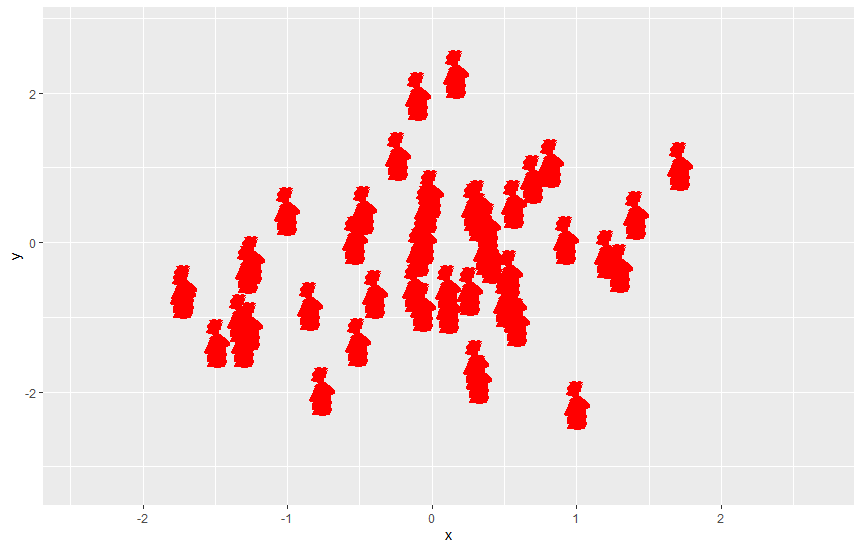
> sessionInfo()
R version 4.0.5 (2021-03-31)
Platform: x86_64-w64-mingw32/x64 (64-bit)
Running under: Windows 10 x64 (build 19041)

Matrix products: default

Random number generation:
 RNG:     Mersenne-Twister
 Normal:  Inversion
 Sample:  Rounding

locale:
[1] LC_COLLATE=French_France.1252  LC_CTYPE=French_France.1252    LC_MONETARY=French_France.1252
[4] LC_NUMERIC=C                   LC_TIME=French_France.1252

attached base packages:
[1] grid      stats     graphics  grDevices utils     datasets  methods   base

other attached packages:
[1] ggimage_0.2.8       ggplot2_3.3.3       oligoClasses_1.52.0

loaded via a namespace (and not attached):
 [1] SummarizedExperiment_1.20.0 tidyselect_1.1.1            purrr_0.3.4                 lattice_0.20-41
 [5] colorspace_2.0-0            vctrs_0.3.8                 generics_0.1.0              stats4_4.0.5
 [9] utf8_1.2.1                  gridGraphics_0.5-1          rlang_0.4.11                pillar_1.6.0
[13] glue_1.4.2                  withr_2.4.2                 DBI_1.1.1                   BiocGenerics_0.36.1
[17] affyio_1.60.0               matrixStats_0.58.0          GenomeInfoDbData_1.2.4      rvcheck_0.1.8
[21] foreach_1.5.1               lifecycle_1.0.0             zlibbioc_1.36.0             MatrixGenerics_1.2.1
[25] Biostrings_2.58.0           munsell_0.5.0               gtable_0.3.0                codetools_0.2-18
[29] labeling_0.4.2              Biobase_2.50.0              ff_4.0.4                    IRanges_2.24.1
[33] GenomeInfoDb_1.26.7         curl_4.3.1                  parallel_4.0.5              fansi_0.4.2
[37] Rcpp_1.0.6                  scales_1.1.1                BiocManager_1.30.12         DelayedArray_0.16.3
[41] S4Vectors_0.28.1            magick_2.7.1                jsonlite_1.7.2              XVector_0.30.0
[45] bit_4.0.4                   digest_0.6.27               dplyr_1.0.5                 GenomicRanges_1.42.0
[49] cli_2.5.0                   tools_4.0.5                 bitops_1.0-7                magrittr_2.0.1
[53] RCurl_1.98-1.3              tibble_3.1.1                crayon_1.4.1                pkgconfig_2.0.3
[57] ellipsis_0.3.2              Matrix_1.3-2                ggplotify_0.0.6             iterators_1.0.13
[61] R6_2.5.0                    compiler_4.0.5
Hello,
I tried to plot 300 images with geom_image. It worked, but when I try to color images, most of images vanished.
Do you know why ?